Take control of your customer relations. Manage your workflows and monitor your performance through key indicator tracking.
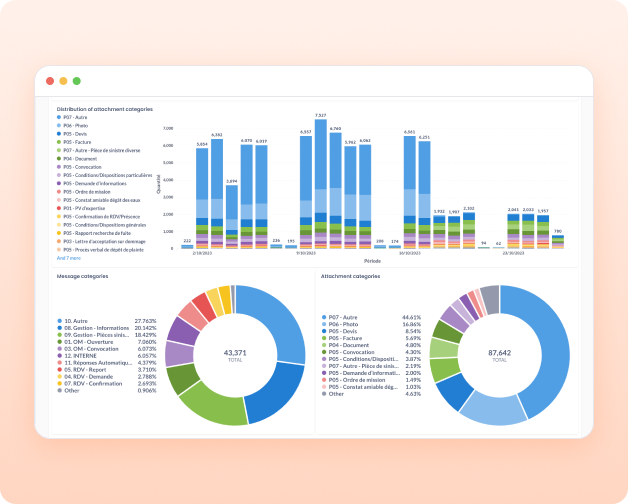
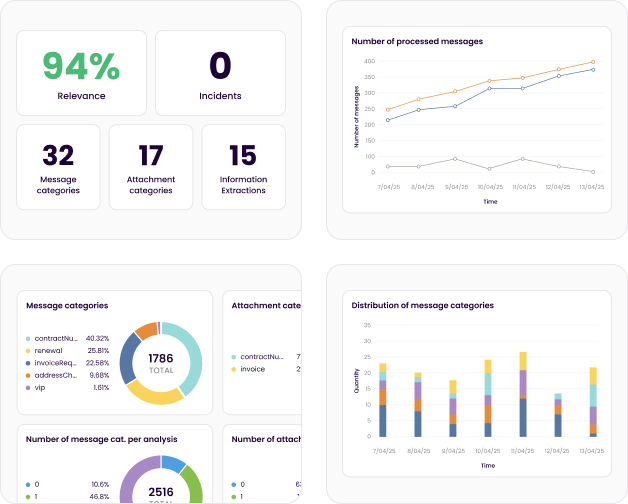
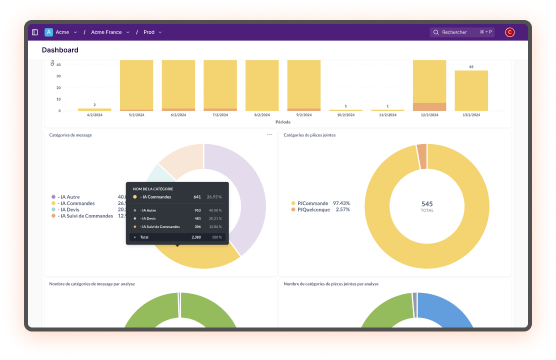
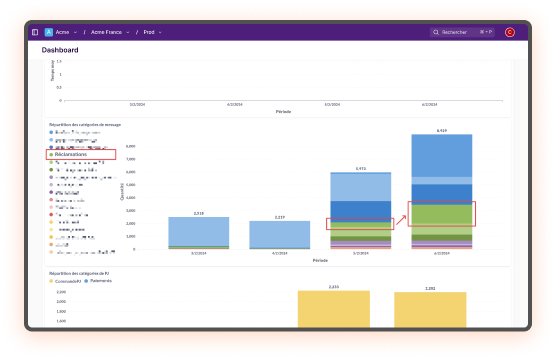
Dashboard
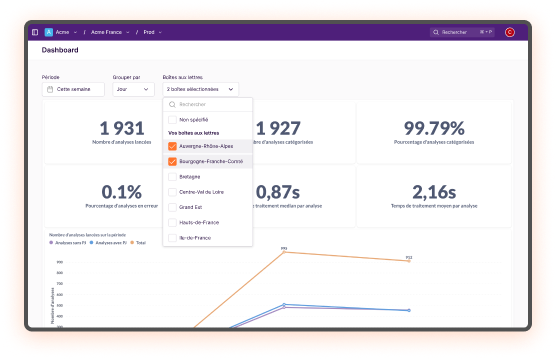
Track your performance
Number of messages analyzed, success rate, or processing time — identify trends, adjust your strategy, and enhance your customer service.
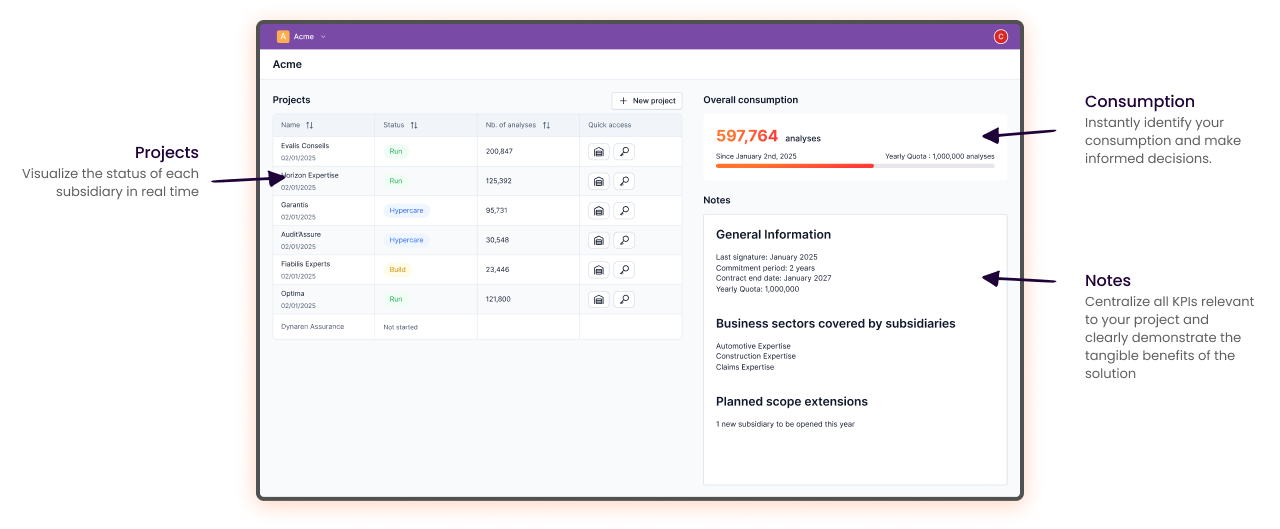
Project Management
Take control of your projects
Monitor solution deployment in real time, whether at the entity or group level. Identify opportunities and boost your ROI.
How our customers use Cockpit
A customer in the retail industry noticed that the number of messages categorized as “Quote Request” was twice as high as those categorized as “Order” over the same period.
They were able to adjust resource allocation by increasing the number of agents in the “Quote Request” team.
For another e-commerce company, the dashboard revealed twice as many orders as quote requests, leading to a strategic decision to strengthen the order management team.
The tool enabled a logistics company to anticipate demand peaks and optimize its deliveries.
An insurance company identified a high demand for a specific coverage and adjusted its offerings accordingly.
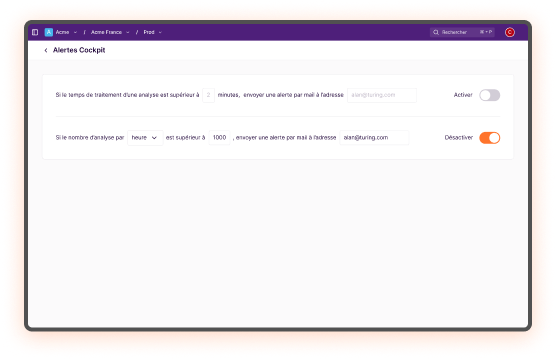
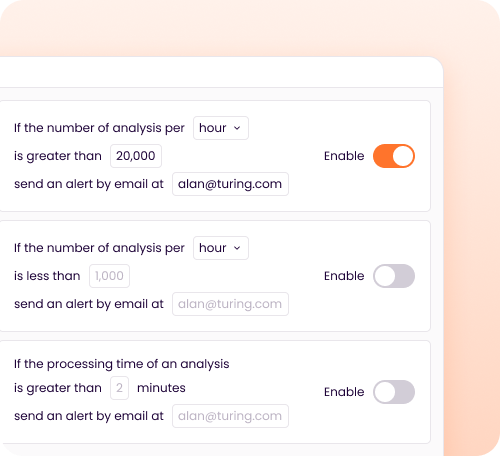
Alerts
Control your flows in real time
React quickly to changes in your flow. If your message volume drops or spikes within the hour, day, or week, you’ll receive an email alert so you can respond promptly. If an analysis takes too long, you’ll be notified to handle the request manually.
Analyze, Optimize, Perform
Consumption of analyses
Don't let your resources go unused! Get a quick overview of your consumption and make informed decisions.
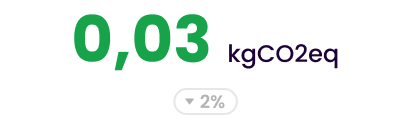
CO2 Consumption
Integrate an ecological dimension into your project management. Assess the carbon footprint of your initiatives and make more responsible decisions.
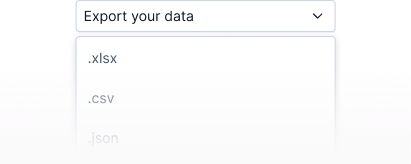
Data Export
Export your data in .xlsx, .csv, or .json to integrate them into your own tools.
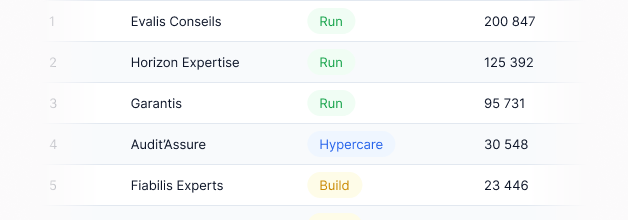
Overview of subsidiaries
Visualize in real time the status of each subsidiary: those already active and those to be opened. Prioritize your actions to avoid underutilizing your resources and accelerate deployment across all your teams.
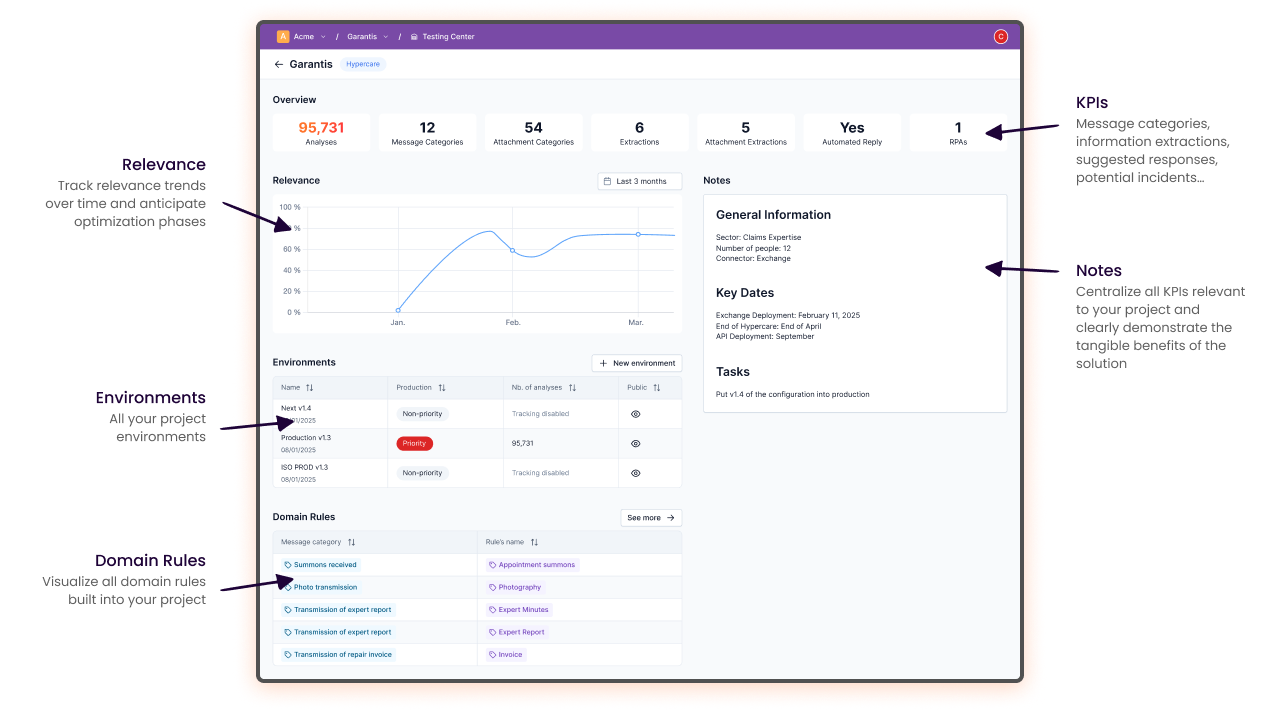
Project Relevance
The relevance rate of your analyses fluctuates, and that's normal! Our tracking dashboard shows its evolution and helps you anticipate optimization phases.
Ready to go?
Try out our powerful, explainable and adaptable AI.
This site uses cookies to provide a personalized and secure experience for users. Cookies allow us to understand user behavior on the site and improve the site. By continuing to navigate the site, you thereby agree to our use of cookies.